
Starting with Google Analytics 4 can feel confusing.
You open the dashboard and suddenly see users, sessions, events, engagement rate, key events, traffic sources and a lot more.
Which numbers should you actually look at?

If you are new to digital marketing, you do not need to track every GA4 metric from day one. In fact, trying to watch everything can make reporting harder.
Start with a small set of useful metrics.
The right metrics can help you understand where your visitors come from, what they do on your website and whether your marketing efforts are bringing useful results.
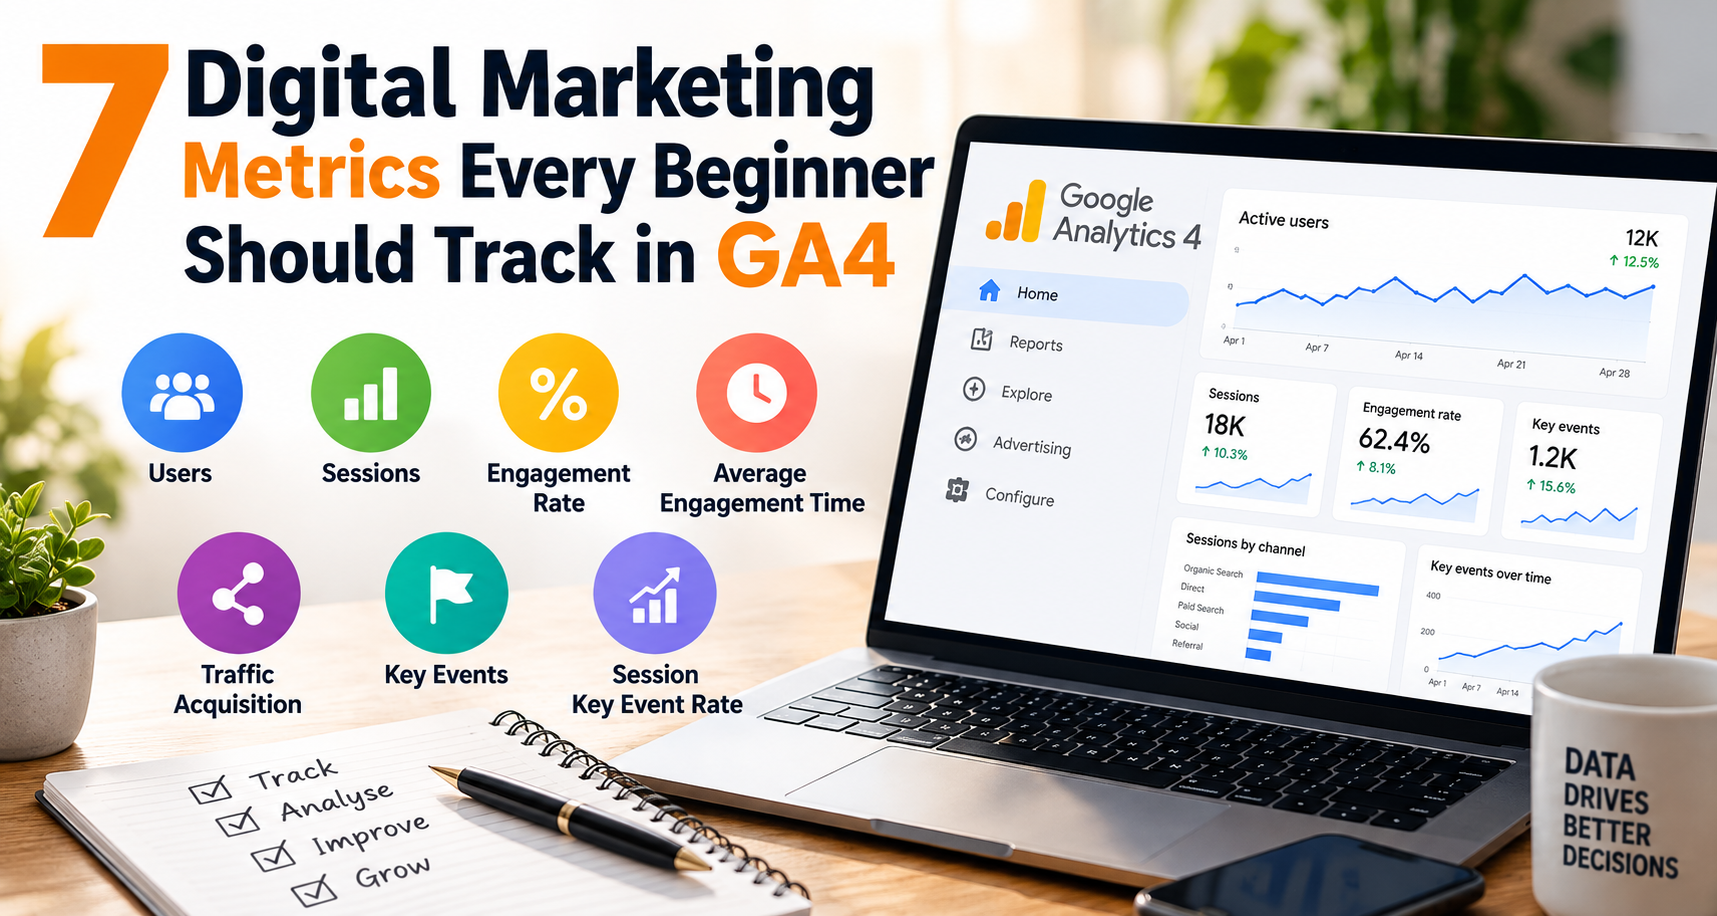
In this guide, we will look at 7 digital marketing metrics every beginner should track in GA4, along with simple examples of when each metric is useful.
What Is GA4?
Google Analytics 4, commonly called GA4, is Google’s analytics platform for measuring activity across websites and apps.
Unlike older versions of Google Analytics, GA4 uses an event-based measurement model.
That means actions such as page views, video plays, downloads, form submissions and purchases can be measured as events.
This gives digital marketers more flexibility when studying how people interact with a website.
For a beginner, the easiest way to think about GA4 is this:
You bring people to your website.
GA4 helps you understand what they do after they arrive.
Did they read an article?
Did they visit another page?
Did they fill out a form?
Did they buy something?
Did they leave without taking another action?
These are the questions your analytics data can help answer.
Why Should Beginners Track GA4 Metrics?
Imagine you are running SEO, social media and Google Ads for a local business.
Website traffic increases by 40%.
Sounds good, right?
But what if most of those visitors leave quickly and nobody fills out the enquiry form?
The traffic number alone does not tell the full story.
This is why you need to look at several metrics together.
For example:
- Users tell you about the people visiting your site.
- Sessions show visits to your site.
- Engagement rate gives you an idea of meaningful interaction.
- Average engagement time shows how long visitors actively engage.
- Traffic acquisition tells you where sessions come from.
- Key events show important actions.
- Session key event rate helps you understand how often sessions lead to those actions.
The goal is not to collect more numbers.
The goal is to understand what those numbers mean.
7 GA4 Metrics Every Beginner Should Track
1. Active Users
Active users are one of the first metrics beginners should understand.
This metric gives you an idea of how many users are actively interacting with your website or app during a selected period.
You can use it to understand whether your website is attracting people over time.
For example, suppose your website received:
- 2,000 active users in January
- 2,400 active users in February
- 3,100 active users in March
The upward trend tells you that your audience is growing.
But do not stop there.
Ask another question.
Where did those users come from?
Maybe SEO brought 1,500 users.
Social media brought 700.
Paid advertising brought 500.
Direct traffic brought 400.
Now your data becomes more useful.
When Should You Check Active Users?
You can use active users when comparing:
- Month-on-month website growth
- Campaign periods
- SEO traffic growth
- Seasonal traffic
- New website content
- Marketing campaigns
Do not judge performance from one day of data.
Look at trends over a longer period.
A single day’s traffic can change for many reasons.
2. Sessions
A session represents a period of interaction with your website or app.
In GA4, a session starts when a user views a page or screen, and no session is already active. By default, a session ends after 30 minutes of inactivity.
Why should a beginner care about sessions?
Because users and sessions are not the same thing.
One person can visit your website more than once.
For example, someone may:
- Visit your website in the morning
- Leave
- Return in the evening
- Come back again the next day
That activity can result in multiple sessions from the same user.
Example
Suppose your website has:
- 1,000 active users
- 1,500 sessions
That tells you that your website received more sessions than users.
This can happen when people return to your website.
Sessions become especially useful when you compare them with engagement and key events.
A website may have many sessions but very few meaningful actions.
That is where the next metrics become useful.
3. Engagement Rate
Engagement rate is one of the most useful GA4 metrics for beginners.
It tells you the percentage of sessions that were engaged sessions.
In GA4, a session counts as engaged when it lasts longer than 10 seconds, includes a key event, or has at least two page or screen views.
The basic idea is simple.
A higher engagement rate generally means a larger share of sessions met one of GA4’s engagement conditions.
Example
Suppose you have:
- 1,000 sessions
- 650 engaged sessions
Your engagement rate would be 65%.
Now compare two landing pages.
Page A:
- 500 sessions
- 70% engagement rate
Page B:
- 500 sessions
- 35% engagement rate
Both pages received the same number of sessions.
But people interacted with them differently.
That gives you a reason to investigate Page B.
Maybe the page loads slowly.
Maybe the content does not match the search intent.
Maybe the headline does not match the ad.
Maybe visitors do not know what to do next.
GA4 will not automatically tell you why engagement is low.
You need to combine the metric with page, traffic and user behaviour data.
4. Average Engagement Time
Traffic tells you that someone arrived.
Engagement time gives you another clue about what happened after that.
Average engagement time shows the average amount of time users actively engaged with your website or app during a session or user interaction, depending on the report.
For content marketers and SEO professionals, this can be useful when reviewing articles and landing pages.
Example
Imagine you publish two blog posts.
Article A:
- 1,000 users
- Average engagement time: 18 seconds
Article B:
- 600 users
- Average engagement time: 2 minutes 40 seconds
Article A has more visitors.
Article B appears to hold attention for longer.
Which one is more useful?
You cannot answer that from engagement time alone.
Maybe Article A is a short answer that satisfies the search query quickly.
Maybe Article B is a detailed guide.
This is why metrics should be read together rather than treated as standalone scores.
How Can You Use Engagement Time?
Look at it alongside:
- Landing page
- Traffic source
- Search intent
- Engagement rate
- Key events
If visitors from Google spend time reading your article but do not visit your service page, you might improve internal links or calls to action.
5. Traffic Acquisition
Traffic acquisition helps you understand where sessions are coming from.
This is extremely useful for digital marketing.
Your website might receive traffic from:
- Organic search
- Paid search
- Social media
- Referral websites
- Direct visits
GA4 has both User acquisition and Traffic acquisition reports.
The User acquisition report focuses on how new users first arrive, while Traffic acquisition focuses on where new sessions come from.
That difference can confuse beginners.
Here is an easy way to remember it:
User acquisition = How did this user first find us?
Traffic acquisition = Where did this session come from?
Why Does Traffic Acquisition Matter?
Suppose you manage a coaching website.
Your report shows:
Organic Search:
2,500 sessions
Instagram:
800 sessions
Google Ads:
1,200 sessions
Referral:
300 sessions
Now you can compare the quality of those visits.
Maybe organic search has the highest number of sessions.
But Google Ads produces more enquiries.
That changes how you think about performance.
Traffic volume matters.
Traffic quality matters too.
6. Key Events
This is one of the most valuable metrics for a business website.
A key event represents an action that matters to the success of your business.
For example:
- Contact form submission
- Appointment request
- Product purchase
- Newsletter signup
- Lead form submission
- Phone number click
- Important registration
Google explains that any event you collect can be marked as a key event when it represents an action that is especially important to your business.
The terminology here is worth understanding.
GA4 now uses “key event” for important actions measured inside Analytics. A conversion can be created from a key event when you want to use that action for advertising measurement and campaign optimisation, particularly across Google Ads and Analytics.
Example
Imagine a dental clinic gets:
10,000 website sessions
But only:
80 appointment requests
The 10,000 sessions tell you about traffic.

The 80 appointment requests tell you something much closer to business results.
That is why key events deserve attention.
What Should You Mark as a Key Event?
Do not mark every tiny interaction.
Think about the actions that actually matter.
For a service business:
- Generate lead
- Appointment booking
- Contact form submission
- Phone enquiry
For an e-commerce website:
- Purchase
- Checkout
- Add to cart
For an education website:
- Course enquiry
- Application
- Registration
- Lead form submission
Google recommends events such as generate_lead for measuring lead-generation actions.
7. Session Key Event Rate
The final metric is especially useful when you want to connect website sessions with important actions.
Session key event rate shows the percentage of sessions that resulted in a key event.
This can help answer a simple question:
“How often do visits to my website lead to an important action?”
Example
Suppose you receive:
2,000 sessions
And 100 sessions result in a key event.
Your session key event rate would be 5%.
Now compare two marketing channels.
Organic Search:
- 1,000 sessions
- 70 key-event sessions
Paid Search:
- 600 sessions
- 60 key-event sessions
Organic Search brought more traffic.
Paid Search brought fewer sessions but a higher proportion of sessions resulting in key events.
That gives you something useful to investigate.
You might ask:
- Which keywords brought these visitors?
- Which landing pages did they visit?
- Which campaign generated the actions?
- Was the search intent different?
- Did one channel attract visitors who were closer to making a decision?
This is much more useful than simply saying, “Paid traffic is lower.”
How Beginners Should Read GA4 Metrics Together
This is where many beginners get stuck.
They look at one number and immediately decide whether a campaign worked.
Try looking at the metrics as a group.
Example 1: High Traffic, Low Engagement
You have:
- High sessions
- Low engagement rate
- Low average engagement time
- Very few key events
Possible areas to investigate include:
- Search intent
- Landing page relevance
- Page speed
- Content quality
- User experience
- Traffic targeting
Example 2: Low Traffic, High Engagement
You have:
- Fewer sessions
- High engagement rate
- Strong engagement time
- Good key event rate
This could mean you are attracting a smaller but more relevant audience.
The next step may be finding ways to increase qualified traffic.
Example 3: High Traffic, High Key Events
Now you have something worth studying closely.
Find out:
- Which channel brought the users?
- Which pages did they visit?
- Which campaigns contributed?
- Which landing pages generated actions?
- Which audiences converted?
Then use those findings when planning future campaigns.
A Simple GA4 Dashboard for Beginners
You do not need a complicated dashboard when you are starting.
Track these seven metrics:
| Metric | What it tells you |
| Active users | How many active users visited |
| Sessions | Number of visits |
| Engagement rate | How many sessions were engaged |
| Average engagement time | How long users engaged |
| Traffic acquisition | Where sessions came from |
| Key events | Important actions users completed |
| Session key event rate | How often sessions resulted in key events |
Check them regularly.
A weekly check can help you spot sudden changes.
A monthly comparison is useful for understanding longer trends.
Common GA4 Mistakes Beginners Make
Looking only at traffic
More traffic does not always mean better marketing.
You need to know what those visitors do.
Comparing unrelated periods
Comparing one busy Monday with one quiet Sunday will not tell you much.
Use comparable time periods.
Treating every event as a business result
A page view is useful.
A form submission may be more directly connected to a lead.
Know the difference.
Ignoring traffic source
If traffic increases, find out where it came from.
Was it SEO?
Social media?
Ads?
Referral traffic?
Direct visits?
Tracking too many metrics
A report with 30 numbers can be harder to understand than a report with seven useful ones.
Start small.
Add more metrics when you know why you need them.
How GA4 Helps Digital Marketing Students
GA4 is not just another tool to add to your resume.
It helps you understand what happens after marketing activity brings someone to a website.
For students learning SEO, paid advertising, social media or content marketing, this is a useful skill.
You can connect your marketing work with actual website behaviour.
For example:
SEO → Organic traffic → Engagement → Key event
Google Ads → Paid traffic → Landing page engagement → Key event
Social media → Social sessions → Website interaction → Enquiry
This way of thinking is useful in interviews too.
Instead of saying:
“I know GA4.”
You can explain:
“I use GA4 to check traffic sources, engagement, landing-page behaviour and key events.”
That sounds much more practical because you are explaining what you actually do with the tool.
Why GA4 Should Be Part of a Digital Marketing Course in Nagpur
If you are searching for a Digital Marketing course in Nagpur, GA4 should be one of the tools you learn through practical work.
Reading about analytics is useful.
Working with actual reports is better.
A good learning process can include:
- Setting up a GA4 property
- Understanding events
- Reading acquisition reports
- Checking landing pages
- Creating key events
- Analysing campaign traffic
- Building simple reports
- Connecting GA4 data with SEO and advertising decisions
You can then practise with a demo website or your own project.
That gives you something concrete to discuss when applying for internships or digital marketing jobs.
E-E-A-T for GA4 and Digital Marketing Content
For digital marketing content, E-E-A-T means:
Experience
Expertise
Authoritativeness
Trustworthiness
These signals matter because readers want accurate information, especially when they are learning tools that can affect business decisions.
Experience
Use real examples.
Explain how a marketer might interpret 2,000 sessions, a 60% engagement rate or 50 key events.
Expertise
Explain GA4 terminology correctly.
For example, distinguish between User acquisition and Traffic acquisition instead of treating them as the same report.
Authoritativeness
Content should be supported by reliable sources.
For GA4 terminology and features, Google’s official Analytics documentation is the strongest reference point.
Trustworthiness
Do not promise that a particular metric automatically proves a campaign was successful.
Explain the context.
For example, a high engagement rate does not automatically mean a website generated more revenue.
The same applies to low engagement.
Always look at the user’s journey and the business goal.
Frequently Asked Questions About GA4 Metrics
- Which GA4 metrics should a beginner learn first?
Start with active users, sessions, engagement rate, average engagement time, traffic acquisition, key events and session key event rate.
These give you a basic picture of traffic, engagement, acquisition and business actions.
- What is the most important GA4 metric?
There is no single metric that is most important for every website.
For a lead-generation website, key events may be especially useful.
For a content website, engagement and traffic acquisition may deserve more attention.
For ecommerce, purchase-related metrics can be more important.
Your business goal should decide what you track.
- What is the difference between users and sessions in GA4?
Users represent people interacting with your website or app.
Sessions represent visits or periods of activity.
One user can have multiple sessions.
- What is a good engagement rate in GA4?
There is no universal number that every website should aim for.
Compare your engagement rate across similar pages, channels and time periods.
A blog, e-commerce store and lead-generation website can have very different user behaviour.
- What are key events in GA4?
Key events are actions that matter to your business.
Examples include purchases, lead submissions, appointment requests and registrations.
You first need to collect the relevant event and then mark it as a key event in GA4.
Start With Seven Metrics, Not Fifty
GA4 can look overwhelming when you first open it.
That is normal.
You do not need to understand every report immediately.
Start with these seven:
- Active users
- Sessions
- Engagement rate
- Average engagement time
- Traffic acquisition
- Key events
- Session key event rate
Then ask simple questions.
Where are my visitors coming from?
Are they engaging with the website?
Which pages are attracting attention?
Are people completing the actions that matter?
Which channel brings useful visitors?
Once you start asking these questions, GA4 becomes much easier to understand.
And if you are learning digital marketing professionally, do not just memorise metric definitions.
Open the reports.
Look at the numbers.
Compare two pages.
Compare two traffic sources.
Find a change and ask why it happened.
That practical habit is what turns GA4 from a dashboard into a useful digital marketing skill.